|
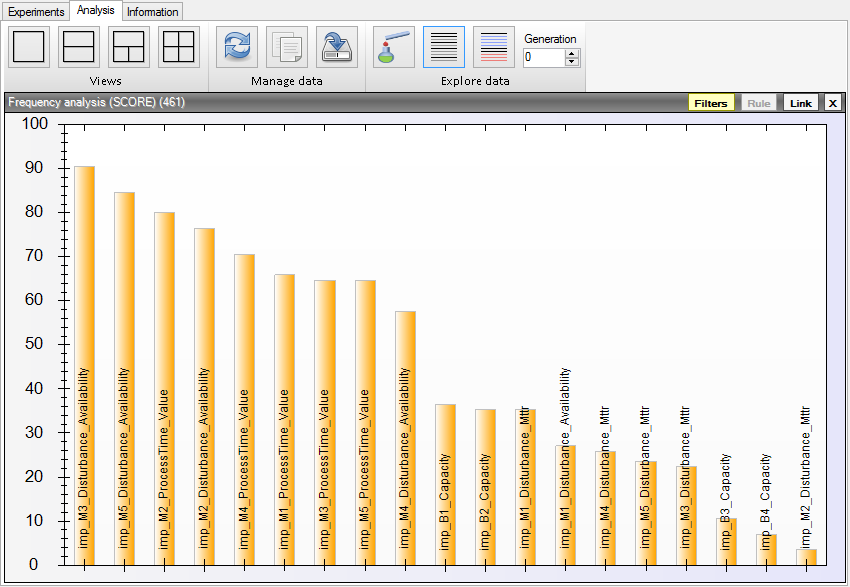
The SCORE Frequency Diagram is used to visualize the results from a SCORE optimization. SCORE optimization inputs (i.e. bottlenecks) are ordered based on the frequency that they appear with their improved value among the best solutions found in the optimization, see example to the right.
The process of creating this frequency diagram is detailed below. |
|
Creating the SCORE Frequency Diagram
- Load your SCORE optimization under the Experiments tab in the Experiment Browser.
-
Go to the Analysis tab in the Experiment Browser
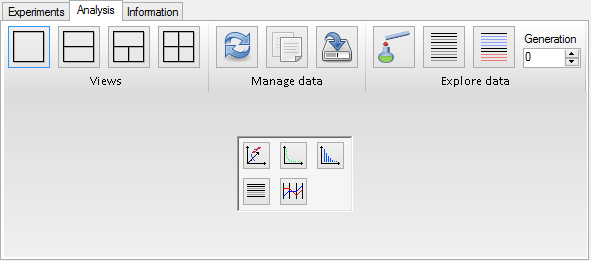 .
.
-
Select the SCORE Frequency Diagram
 from the palette of diagram types
 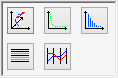 .
.
-
Select your loaded SCORE optimization
 .
.
-
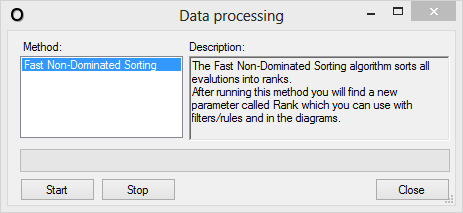
Perform the non-dominated sorting. Found among the post processing actions under
 .
.
-
Select the best soltions using a filter. Filters are added under
 .
.
-
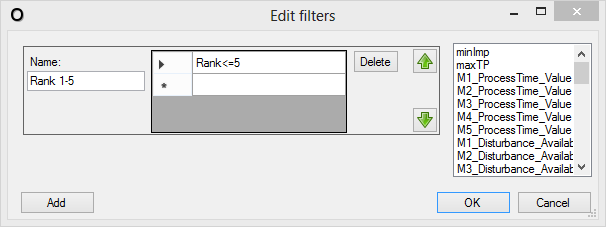
Add a filter using the
 -button.
- Give the filter a suitable name in the Name-field.
- Enter a formula to filter out the desired ranks, e.g. Rank <= 5.
-
Done! Press the
 -button.
-
Add a filter using the